


Who This Guide Is For
This guide is written for box truck owner-operators who already run freight and manage their own profitability. It is a decision framework for operators who want repeatable margins, not lucky weeks.
The Selection Gap
Two owner-operators look at the same load board. One sees a $900 load for 250 miles and books it instantly, feeling a rush of victory. The other passes, opting instead for a $750 load going 200 miles in a different direction. At week’s end, the second operator has more net profit.
This is the Selection Gap. It’s the difference between being a freight scavenger – reacting to gross rates – and a business strategist – acting on unit economics. For a box truck, every load is a strategic business decision that either compounds efficiency or accelerates insolvency.
This guide lays out a data-driven filter for systematically choosing the former.

Why Gross Rate Is a Deceptive Metric for Box Trucks
The most common mistake in box truck operations is evaluating loads by headline pay instead of economic impact. A $900 load feels good in isolation, but box trucks do not operate in isolation – they operate as systems with fixed burn rates. Every mile driven commits fuel, maintenance, time, and opportunity cost. When those inputs aren’t measured, gross rate becomes a misleading signal.
A 26ft box truck has a cost structure that leaves little room for narrative optimism. Unlike large fleets that can offset weak loads with volume, contract density, or backhaul leverage, box truck owner-operators survive on precision decisions. One mispriced load does not “average out” – it directly degrades the week.
Gross rate hides three critical realities:
- Deadhead exposure – unpaid miles quietly dilute real earnings.
- Time compression – loading delays, urban access, or appointments reduce usable driving hours.
- Lane damage – a good-paying load into a weak market can force expensive repositioning later.
This is why profitable box truck operators stop asking, “How much does it pay?” and start asking, “What does it cost me to run?”
The first and non-negotiable filter is knowing your true cost per mile (CPM) – because without it, every rate looks acceptable until it’s too late.
Operators who consistently stay profitable don’t solve this by chasing higher spot rates – they work inside consistent box truck freight that supports predictable lanes and structurally limits deadhead.
What Is a Profitable Rate Per Mile for a 26ft Box Truck in 2026?
Based on anonymized owner-operator P&L records, dispatch-side financial reviews, and current fuel and maintenance averages, the all-inclusive cost per mile (CPM) for a well-maintained 26ft box truck in 2026 typically falls between:
$2.15 – $2.40 per mile
This includes:
- Fixed costs: Truck payment or lease, insurance, permits, base LLC expenses
- Variable costs: Fuel, maintenance reserve, tires
- Owner compensation: Your salary, separate from profit
Anything below this range is not “tight margins.” It is operating at a loss.
CPM ranges and benchmarks vary by operation, region, and fuel pricing, but the decision framework remains consistent across profitable box truck operations. These decisions directly influence your yearly income. Here’s how owner-operator salary numbers look in 2026.
The Math That Exposes the Illusion
On the load board, the numbers look convincing. A $900 load moving 250 miles shows a clean $3.60 per loaded mile. For many box truck operators, that’s enough to trigger an instant “book it.” On paper, with a cost per mile of $2.25, the math suggests a healthy margin.
Formula (Loaded Rate):
$900 ÷ 250 miles = $3.60/mi
Using a $2.25 CPM, the expected profit appears straightforward:
Formula (Presumed Profit):
($3.60 − $2.25) × 250 miles = $337.50
The problem is that box trucks don’t move on paper – they move on pavement.
To pick up the load and reposition after delivery, the truck runs another 80 unpaid miles. Those miles still burn fuel, consume time, and add mechanical wear. Once they’re counted, the trip is no longer 250 miles – it’s 330 total miles.
Formula (Effective Rate Including Deadhead):
$900 ÷ (250 loaded + 80 deadhead) = $900 ÷ 330 = $2.73/mi
Now the margin collapses.
Formula (Real Profit):
($2.73 − $2.25) × 330 miles = $158.40
More than 53% of the expected profit disappears – not because the rate changed, but because the full mileage was finally acknowledged.

This is how “good loads” quietly fail. Not dramatically. Not obviously. They fail by hiding their true cost until the week is over and the numbers don’t reconcile.
What Is Effective Rate Per Mile?
Effective rate per mile is total load revenue divided by all miles driven, including deadhead.
It reflects the true earning power of a load and is the only rate that matters for box truck profitability.
The Deadhead Multiplier: Your Biggest Controllable Cost
For box trucks, deadhead is not bad luck. It is a planning failure tax.
Because box trucks operate in narrower service corridors, every empty mile carries more weight. There is less flexibility, fewer backhaul options, and far less room to “make it up later.” That’s why deadhead must be measured and priced into every load decision, not justified after the week goes sideways.
The simplest way to expose deadhead’s real impact is to convert it into an effective rate, not a guess.
Formula: Effective Rate Calculation
A load’s true value is determined by how much revenue it generates after accounting for empty miles.
Effective Rate = Loaded Revenue ÷ (1 + Deadhead Percentage)
Here’s how it plays out in a typical box truck scenario.
A load pays $750 for 200 loaded miles. On the surface, it looks workable. But reaching the pickup and repositioning after delivery adds 50 empty miles.
Deadhead percentage:
50 ÷ 200 = 25%
Once deadhead is included, the math changes.
Effective value:
$750 ÷ 1.25 = $600
Total miles driven:
200 loaded + 50 deadhead = 250 miles
Effective rate per mile:
$600 ÷ 250 = $2.40/mi
At a $2.25 CPM, the margin on this load is nearly gone.

Plain English:
A 25% deadhead tax quietly turns a $750 load into the equivalent of a $600 zero-deadhead run. Nothing went wrong operationally – the load simply wasn’t priced high enough to survive its own empty miles.
This is why deadhead is the most controllable cost in box truck operations – and the most dangerous one to ignore.
Industry benchmark:
Profitable box truck operators maintain deadhead below 25%. Top earners target 15% or less.
What Is a Good Deadhead Percentage for Box Trucks in 2026?
For most box truck operations, deadhead above 25% is unsustainable unless the loaded rate increases proportionally. Operators who consistently stay profitable plan lanes to keep deadhead under 20%, with elite operators operating closer to 15%.
Deadhead control is not optimization – it is survival.
The Lane Fitness Test: Does This Load Build Your Business?
Random load selection creates scattered routes and forces expensive repositioning. Strategic operators build repeatable lanes, not miles.
Your objective is not to cover a 300-mile radius – it is to dominate a predictable 150-mile corridor.
Lane Filter Questions
- Return factor: Does this lane end near known freight or my home base?
- Market density: Is this a freight-producing area or a dead-end consumption zone?
- Recurrence potential: Can this become a repeat lane or contract run?
If the lane does not support future freight, the rate must pay for a full return – up front.
The Liquidity Trap: When a “Good Load” Breaks Your Week
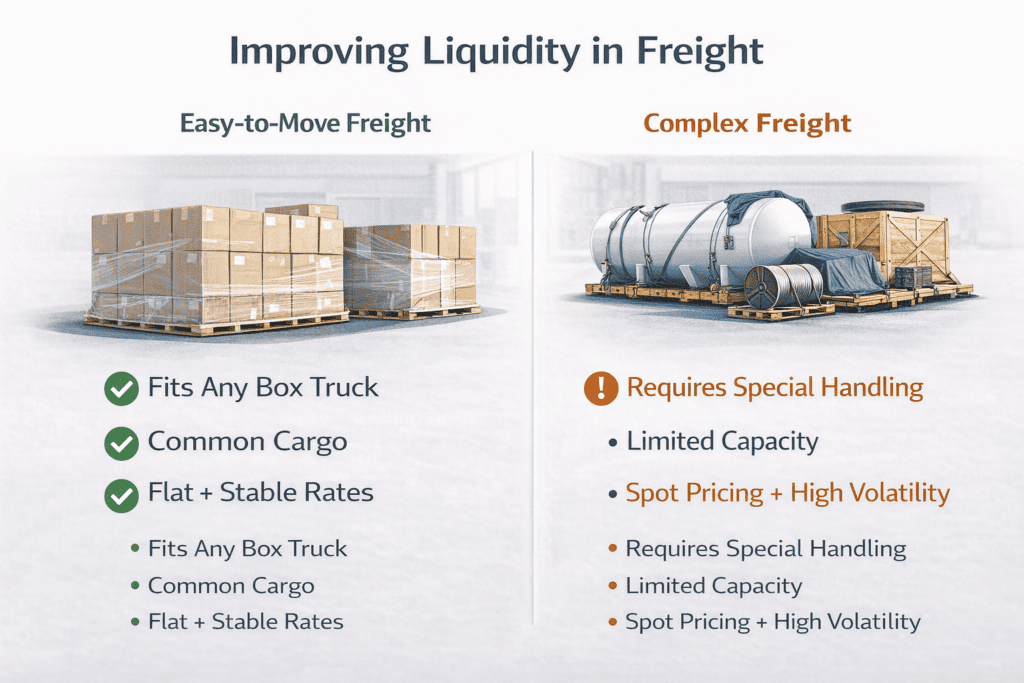
Not all freight converts time into cash equally.
A dock-high, palletized, single-stop load is liquid freight. It moves predictably and closes clean.
Loads with special handling, tight urban access, multiple stops, or fragile cargo are illiquid. The hidden costs – delays, stress, claim exposure, and wasted hours – regularly erase profit.
A three-hour delivery delay can wipe out an entire short-haul margin.
For box trucks, the most profitable load is often the boring one that finishes on time.
Instant Reject Loads (Operational Rule)
Some loads don’t need deeper analysis. They fail on structure alone.
Automatically reject loads that include:
- Dead-end markets with no reliable outbound freight
- Multi-stop urban deliveries without a clear rate premium
- Special handling requirements with no explicit compensation
- Tight appointment windows that offer no detention terms
These loads don’t just reduce profit – they steal time, compress flexibility, and increase week-ending risk. Discipline at this stage protects your schedule, your margin, and your ability to accept better freight later. Every load decision starts with knowing your true operating floor. If you haven’t calculated it fully, review how real cost per mile is determined before filtering freight.
The Profitable Box Truck Load Selection Algorithm
This five-step filter turns load selection from instinct into a repeatable operating rule. Apply it the same way, every time.
Step 1: Hard Cost Filter
Rule:
Loaded rate must exceed CPM × 1.4.
This is your survival margin. The 40% buffer absorbs fuel swings, small delays, minor deadhead variance, and basic overhead without pushing the week into loss.
Formula:
Loaded Rate > CPM × 1.4
Example:
At a $2.25 CPM, your minimum acceptable loaded rate is:
$2.25 × 1.4 = $3.15 per loaded mile
If a load fails this step, no other factor can save it. Reject immediately.
Step 2: Deadhead Filter
Rule:
Deadhead must remain under 25%, or the effective rate after deadhead must still meet Step 1.
Deadhead is not neutral. Every unpaid mile lowers the effective rate and compresses margin. High deadhead demands a proportionally higher loaded rate – otherwise the load becomes structurally weak.
Condition:
Deadhead < 25%
OR
Effective Rate ≥ CPM × 1.4 after adjustment
If neither condition holds, the load fails – regardless of how attractive it looks on the board.
Step 3: Lane Fitness Filter

Rule:
The load must connect to a productive lane, or the rate must compensate for a dead-end return.
Loads that pull your truck into weak markets force future deadhead. Even a strong-paying run can damage the week if it breaks lane continuity.
Ask:
Does this move strengthen a repeatable lane, or am I being paid to exit and reposition?
If the answer is no to both, reject. Many drivers accept loads they already know are weak. Here’s why owner-operators take bad loads – even when they know better.
Step 4: Liquidity / Risk Filter
Rule:
If freight complexity exceeds standard straps and pallet-jack handling, add a 15–20% risk premium to your required rate.
Complex loads increase:
- Delay probability
- Claim exposure
- Time compression
- Mental load
If the adjusted rate does not clear your CPM × 1.4 threshold after adding the risk premium, the load is not viable.
Step 5: Final Booking Rule
A load is bookable only if it passes this compound condition:
(Loaded Rate > CPM x 1.4) + (Deadhead % < 25%) + (Fits Strategic Lane) + (Low Liquidity Risk) = TRUE
If you want a fast decision tool, use this 60-second load checklist before booking.
Conclusion: From Load-Taker to Business Architect
Most box truck operators don’t struggle because rates are low. They struggle because they lack a repeatable selection system and rely on instinct under pressure.
At ExpeditedJobs, we see this pattern repeatedly: operators who apply disciplined load selection outperform those chasing headline rates – regardless of market conditions.
Sustainable operations are built by systematically rejecting the wrong loads. Saying no to the wrong $900 load is what creates capacity for the right $750 one – the load that actually builds margin, stability, and leverage.
Your load board is not a menu. It is a raw material feed. Filter it relentlessly.
Summary
For box truck owner-operators, profitable load selection in 2026 requires a four-layer filter:
- Loaded rate must exceed CPM × 1.4 (typically >$3.15/mi),
- Deadhead must stay below 25%,
- Loads must support strategic lane building, and
- Freight liquidity and risk must be priced explicitly.
Core rule:
(Rate > CPM × 1.4) + (Deadhead < 25%) + (Fits Home Lane) = BOOK
[Get matched with consistent, low-deadhead box truck freight]

Table of Content
- Who This Guide Is For
- The Selection Gap
- Why Gross Rate Is a Deceptive Metric for Box Trucks
- What Is a Profitable Rate Per Mile for a 26ft Box Truck in 2026?
- What Is Effective Rate Per Mile?
- The Deadhead Multiplier: Your Biggest Controllable Cost
- What Is a Good Deadhead Percentage for Box Trucks in 2026?
- The Lane Fitness Test: Does This Load Build Your Business?
- The Liquidity Trap: When a “Good Load” Breaks Your Week
- Instant Reject Loads (Operational Rule)
- The Profitable Box Truck Load Selection Algorithm
- Conclusion: From Load-Taker to Business Architect
- Summary


